
Understand Minecraft RAM, CPU and storage usage
CloudExaRAM, CPU and storage solve different problems. Check the panel graphs alongside the console and the time players reported a problem before changing your plan. A high reading on its own does not explain a crash or prove that you need an upgrade.
Record the problem while it happens
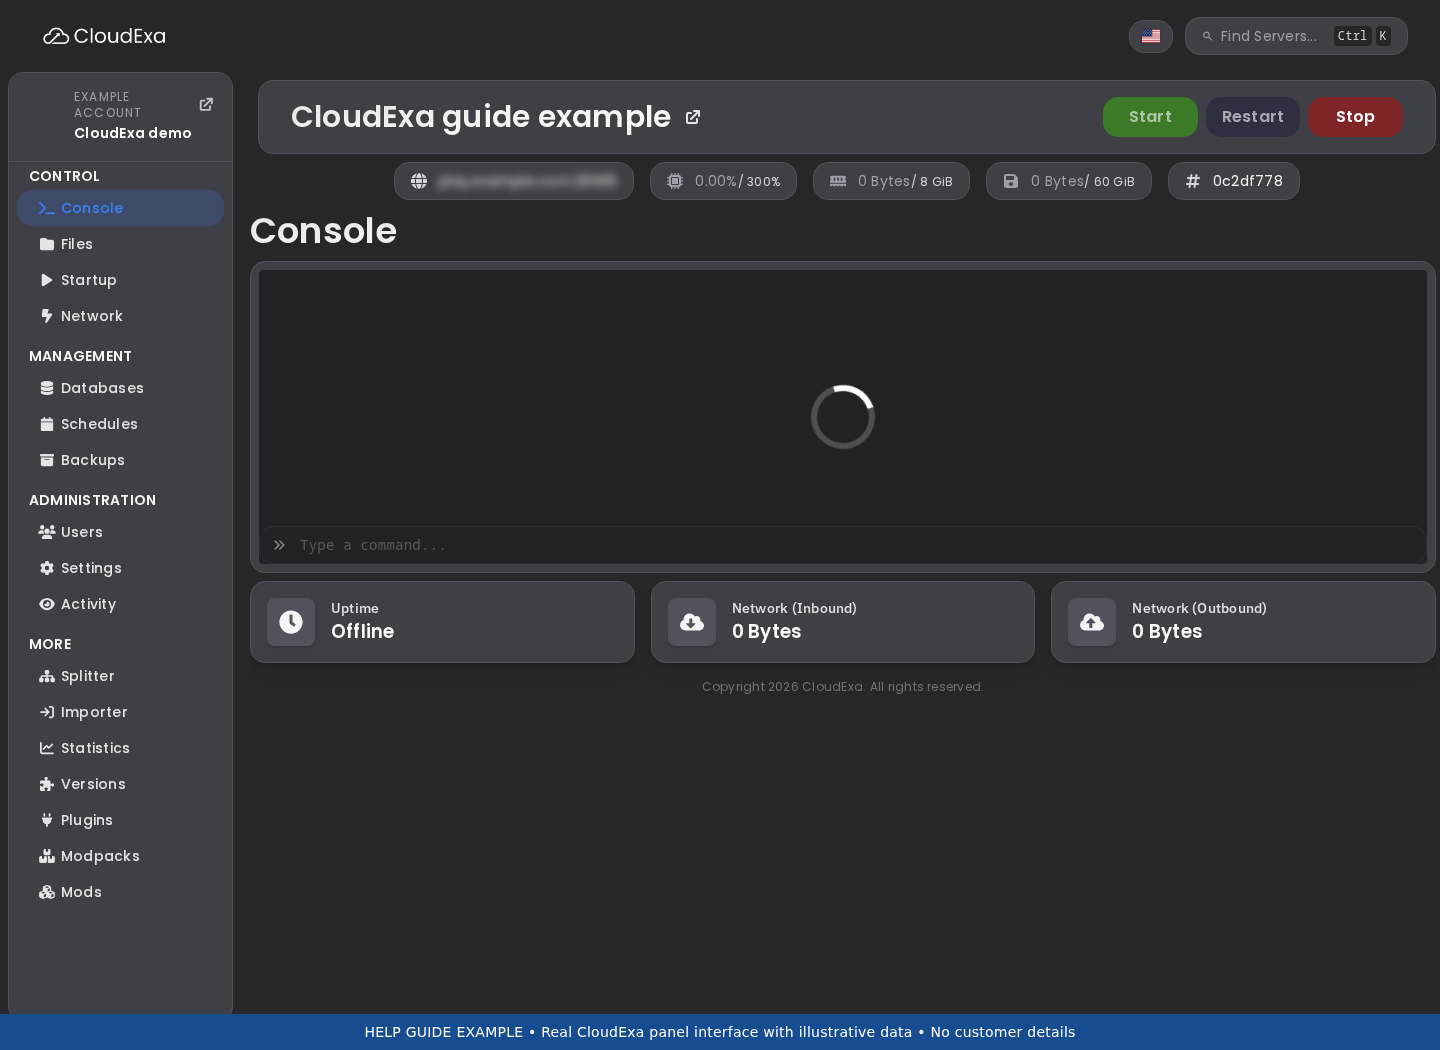
- Open your server's Console resource graphs and Statistics in the game panel.
- Write down the RAM, CPU and disk limits, player count and time of the issue. Capture a useful graph interval rather than a single reading.
- Read the console lines immediately before the error or stop. Use the log guide if you need an older event.
- Note what changed: a plugin, new world, view distance, player event or imported archive. Keep a backup before changing configuration.
RAM: check the limit and the error
Java reserves memory and reuses it, so you should not expect the RAM graph to return to zero after players leave. Panel memory can include more than Java's heap. Leave room for the runtime and native allocations; setting the Java heap to the entire container limit can cause a failure.
OutOfMemoryError in a Java log indicates a JVM allocation problem. A sudden process exit without a normal shutdown needs a wider check. Ask support to inspect the node and container events before assuming the game needs more RAM. A host-level outage can look similar from inside the game.
Compare memory while idle and during normal player activity. If usage keeps rising until each crash, review recent plugins and collect evidence before increasing the limit. Avoid changing several plugins and Java flags at once.
CPU: look for slow ticks
Chunk generation, entities and plugins can create CPU spikes. Minecraft can have a busy main thread even when other cores are free. Compare the graph with player reports, tick time and console warnings. A CPU percentage may use the convention of 100% per logical core; compare it with your assigned limit instead of treating 100% as the whole machine.
For supported Paper versions with spark available, collect a profile while players experience the lag. From the panel console, without a leading slash:
spark profiler start --timeout 600After the ten-minute sample, save the report link. Review it before sharing because reports can include server details. Use the plugin or Paper documentation if that command is unavailable. A profile recorded while the server is idle may miss the cause.
Storage: count archives as well as worlds
Check Files for large world folders, logs and uploaded archives. An extracted archive and its original ZIP or tar file can occupy space at the same time. World exploration, maps and plugin databases can also grow over time. A storage-full message is not a request for more RAM.
Do not delete world, player or plugin data to make space. Download and verify a separate copy before removing an archive you no longer need. If you cannot identify the largest files or the panel reports more usage than you can account for, ask support to inspect usage. Off-machine backups and temporary restore space have different capacity requirements.
Choose the next step
Send support the server ID, timestamp, graphs, error and spark report if relevant. State whether you want advice or a paid upgrade. We can help guide.distinguish a plan limit from a plugin problem or node fault. Keep storage, CPU and RAM requirements separate when requesting a change.
Reference: Paper's spark profiling guide. For JVM settings, use documentation that matches your installed Java and Paper versions.