spark tasks
Task guides and troubleshooting for spark. Check the installed release before changing configuration or data.
- Capture only slow ticks with a bounded spark profile
- Choose a main-thread or all-thread spark recording
- Separate allocation pressure from a Minecraft memory leak
- Save a spark profile locally before sharing it
- Compare two spark profiles under the same Minecraft workload
- Check and stop an unwanted spark profiler session
Capture only slow ticks with a bounded spark profile
An average profile can hide a short pause among many healthy ticks. Spark can focus a profile on ticks exceeding a chosen duration. This helps investigate a repeatable spike, but its percentages describe the captured slow ticks rather than the entire playing session.
Record the starting point
Record the server version, spark version and the approximate spike frequency. Choose a representative period and a consenting tester for the triggering action. Keep a normal health report or unfiltered profile as a separate baseline so the filtered result has context.
Work through the change
- Check the installed command help and start a bounded recording, for example
/spark profiler start --timeout 120 --only-ticks-over 100. The example selects ticks over 100 milliseconds; choose a threshold relevant to the observed pause. - Repeat the suspected action once or wait for the expected spike. Note its timestamp and player count, without adding unrelated stress to the server.
- Open the resulting viewer and confirm that slow ticks were actually captured. Compare the busiest branches with the action time and the server's tick measurements.
- Make one justified plugin or workload adjustment on a test copy, then record the same filtered test again. Retain the original capture for comparison.
Check the result
A useful capture contains the reported pause and enough context to identify candidate work. A branch dominating filtered samples may still be rare overall. Compare its duration and frequency with normal gameplay before describing it as the server's constant bottleneck.
If the result differs
If the profile is empty, the threshold may exceed the observed ticks or the event may not have occurred. Do not lower every performance setting merely to obtain a busier chart. Repeat during a representative window with a documented threshold.
Cancel an unnecessary recording using the installed profiler controls and revert only the trial workload change if it harms gameplay. Profiling does not require deleting worlds or resetting plugin data. Share the report only after reviewing its metadata.
References and related help
- spark maintainer reference 1
- spark maintainer reference 2
- Diagnose Minecraft lag with TPS, MSPT and spark
- Find Minecraft logs and send useful troubleshooting details
Choose a main-thread or all-thread spark recording
Minecraft tick performance and total process activity are related but different measurements. A main-thread profile can explain expensive tick work, while an all-thread capture can expose activity elsewhere. Selecting the wrong view can make a busy background worker look like the direct cause of low TPS.
Record the starting point
Record whether the symptom is slow ticks, high process CPU, delayed background work or a server that appears to wait. Keep the timestamp and a health snapshot. Use a bounded recording window so an exploratory profile does not run indefinitely.
Work through the change
- Start with the normal server-thread profiler for a tick-performance complaint. Repeat the relevant action and note the player count and workload during the capture.
- If background activity is the question, check command help and use the documented all-thread option, such as
/spark profiler start --timeout 120 --thread *. - In the viewer, inspect the selected thread and its call branches. Compare runnable work with waiting or sleeping states instead of counting every visible thread as active CPU consumption.
- Keep main-thread and all-thread reports labelled separately. Use the same workload for a follow-up capture after a candidate change.
Check the result
The selected report should answer the original question: what consumed tick time, or which background worker was active. Record the thread and time window alongside any screenshot. A high percentage within one selected thread does not automatically equal that percentage of total machine CPU.
If the result differs
If the server is waiting on storage or another service, a CPU-heavy branch may not explain the delay. Compare the observed symptom with spark's metrics and relevant logs. Avoid blaming whichever plugin name is easiest to recognise in a large thread list.
Stop or cancel a recording through spark's controls when enough evidence exists. Restore any trial configuration that does not improve the same workload. Keep performance investigation separate from data cleanup; profiling itself does not justify deleting plugin files.
References and related help
- spark maintainer reference 1
- spark maintainer reference 2
- Diagnose Minecraft lag with TPS, MSPT and spark
- Find Minecraft logs and send useful troubleshooting details
Separate allocation pressure from a Minecraft memory leak
A high allocation rate does not necessarily mean memory is leaking. Java can create many short-lived objects and reclaim them, while a retention problem keeps more live data over time. Compare the measurements before increasing heap or deleting plugin data.
Record the starting point
Record the configured heap, player count, uptime and the time of the reported pressure. Check the service's memory limit separately from Java heap usage. A container limit, native memory and the Java heap are not identical numbers.
Work through the change
- Collect the relevant spark memory and garbage-collection metrics during ordinary play. Note whether usage falls after collection or whether the post-collection baseline keeps rising.
- If allocation work is the question, check your installed spark commands and take a short allocation profile using the documented
--allocoption. Keep it labelled as allocations rather than retained objects. - Compare the capture with a similar period after a single suspected plugin change on a test copy. Keep player count and activity comparable.
- Escalate suspected retained-heap analysis to support with timestamps and measurements. Treat heap dumps as sensitive and potentially large; do not upload one publicly without reviewing its contents and handling requirements.
Check the result
The evidence should show whether pressure follows temporary churn, a growing retained baseline or the service limit. A candidate plugin appearing in an allocation profile indicates object creation, not proof that it retains those objects forever. Keep the distinction clear in a support report.
If the result differs
If the process is killed before Java can report an error, include the panel memory graph and host-side evidence available from support. A flat heap chart does not rule out native or host pressure. Avoid assuming every abrupt exit is a Java leak.
Stop the diagnostic recording and undo an ineffective trial change. Keep ordinary backups before any later data migration, but do not delete worlds or caches solely because they are large. Adjust RAM only after identifying which limit is actually being reached.
References and related help
- spark maintainer reference 1
- spark maintainer reference 2
- Diagnose Minecraft lag with TPS, MSPT and spark
- Find Minecraft logs and send useful troubleshooting details
Save a spark profile locally before sharing it
A performance report can disclose server software, plugin names, paths or other operational details. Spark supports local output for supported reporting commands. Saving locally lets staff inspect a capture before deciding which information should leave the service.
Record the starting point
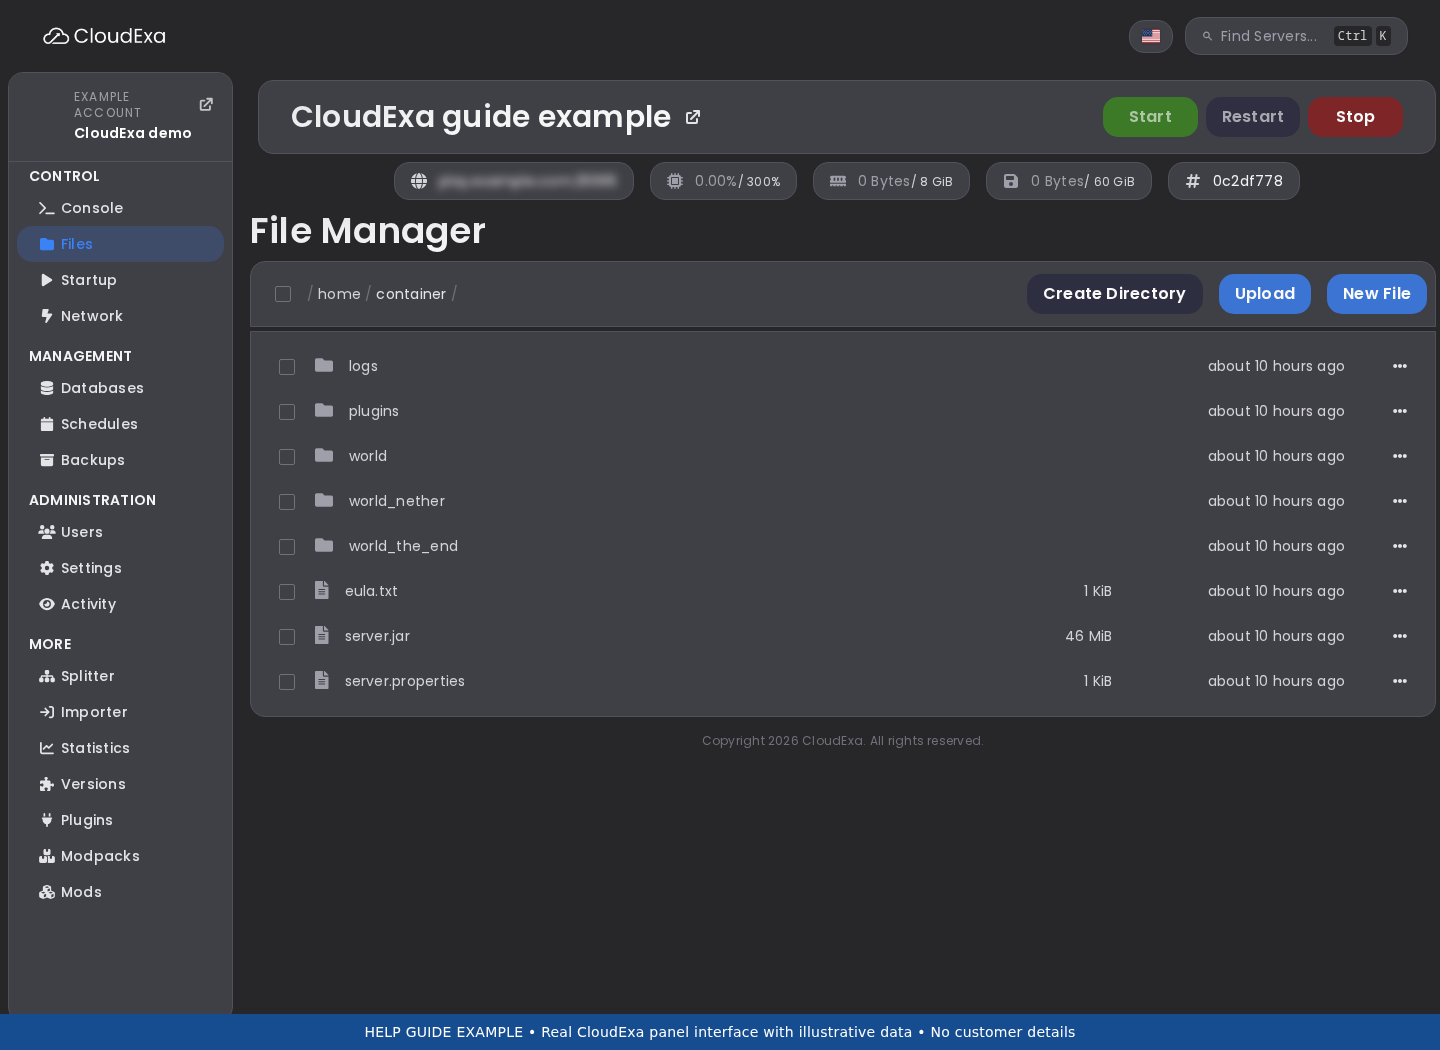
Check the command help for the installed spark build and identify where the service can store diagnostic files. Record the symptom and test window. Ensure there is enough free space for the capture and that the destination is not a publicly downloadable web folder.
Work through the change
- Start a bounded profile for the actual symptom and record the triggering action. Avoid collecting a long idle session when a short reproduction is available.
- Use the documented local save option when stopping the capture, such as
/spark profiler stop --save-to-file. Read the returned location rather than guessing a filename. - Download the saved file through the service's authorised file access. Review its metadata and follow the viewer's supported local-file workflow if you need to inspect the profile without publishing it.
- Share only with the intended support recipient and state which details were removed or withheld. If an upload is necessary, review its visibility and retention before sending the link.
Check the result
You should retain a useful capture with a known private location and an explicit sharing decision. Confirm that the file exists and can be opened through the supported viewer process. A console message alone is not evidence that a downloaded archive is complete.
If the result differs
If the command reports an unsupported flag, check the installed version's help instead of pasting options repeatedly. If saving fails, inspect free space and permissions for that service. Do not make an entire plugin directory publicly readable to retrieve one report.
Cancel the capture if local saving cannot be completed safely, preserving the relevant logs. Remove temporary diagnostic copies only after the investigation's retention needs are understood. Rotate any exposed secret if a report was shared before review.
References and related help
- spark maintainer reference 1
- spark maintainer reference 2
- Diagnose Minecraft lag with TPS, MSPT and spark
- Find Minecraft logs and send useful troubleshooting details
Compare two spark profiles under the same Minecraft workload
A quieter server often looks faster regardless of the configuration change. A fair spark comparison repeats the same workload and reports the conditions beside the result. This prevents a maintenance change from receiving credit for an empty player list.
Record the starting point
Choose one measurable complaint, such as a pause when entering a prepared area. Record the server build, plugin versions, player count and approximate activity. Keep the previous configuration and decide what improvement would be noticeable before changing anything.
Work through the change
- Capture a bounded baseline while repeating the chosen action. Note the time window and whether chunks are already generated or need generation.
- Apply one candidate change on a controlled service copy or planned maintenance window. Avoid combining view-distance, plugin and world-generation changes in one comparison.
- Capture the same duration with comparable players, route and chunk state. Use the same profiler mode and slow-tick threshold if one was selected.
- Compare tick measurements and the relevant call branches, not just the largest percentage. Record any difference in workload that could explain the result independently.
Check the result
A credible result links the changed setting to an observable improvement under similar conditions. Keep both captures and the exact change. If the second test benefits from warmed caches or generated chunks, state that limitation and repeat an equivalent baseline before drawing a stronger conclusion.
If the result differs
If overall percentages shift but tick duration stays similar, the change may have redistributed sampled work without fixing the player's complaint. If the trigger did not occur in one capture, the pair is not a valid comparison. Gather a smaller repeatable test instead.
Restore the previous setting if the change harms gameplay or does not address the measured symptom. Preserve both reports as evidence rather than keeping an unproven tweak permanently. No world reset or player-data removal is part of a profile comparison.
References and related help
- spark maintainer reference 1
- spark maintainer reference 2
- Diagnose Minecraft lag with TPS, MSPT and spark
- Find Minecraft logs and send useful troubleshooting details
Check and stop an unwanted spark profiler session
A staff member may start a profile and lose its console output or leave before the test finishes. Check the profiler state before starting another recording. Spark provides controls for inspecting and ending a session, so a server restart is not the first response.
Record the starting point
Find out who requested the capture and what event it was intended to include. Record the current symptom and approximate start time. Use the command prefix appropriate to the platform; a proxy's profiler is not automatically the same session as its backend's profiler.
Work through the change
- Check installed command help and run the documented profiler information command, such as
/spark profiler info. Confirm the component and active recording details. - If the required event has been captured, stop the session using the normal profiler stop command. Use the supported local save option if the report needs privacy review before upload.
- If the recording is unwanted or contains no useful test, use the documented profiler cancel control rather than killing the Minecraft process.
- Check profiler information again and note the outcome. If another capture is needed, start a new bounded session with an explicit timeout and named test action.
Check the result
There should be one understood recording state and, when saved, a known report location. Share the result with the staff member who requested it. Record a cancelled session as cancelled rather than presenting it as a successful performance capture.
If the result differs
If commands affect no session, confirm whether you are on the proxy, server or client platform and using its correct prefix. If an upload hangs, separate report delivery from the recording state. Repeatedly starting new profiles can make that distinction harder.
Do not restart the service solely to clear an uncertain profiler state. Preserve relevant console output and ask support about a reproducible control failure. Revert only diagnostic settings changed for the abandoned test, leaving worlds and plugin data intact.